When we put out the request for comments on publishing X-Plane usage data four and a half months ago, I had the best of intentions for creating nice, web-based, automatically-published, interactive graphs & charts with all the data we have.
Unfortunately, I’ve been head-down working on top-secret features for X-Plane Desktop (believe me, when you see this stuff, you’ll understand why!), and my analytics data project has just languished (and will continue to languish for many months more as I finish the Desktop features).
So, after a gentle kick in the pants, I’m publishing the data as I have it. It’s not pretty, but I think it will still be useful to third-party developers. We have a handful of easy-to-digest charts, plus a whole bunch of raw data at the bottom of the post for those that are interested.
Note that all data in these charts are for users of the full version only—I’ve filtered out demo users.
Do let me know in the comments if you have questions about the data!
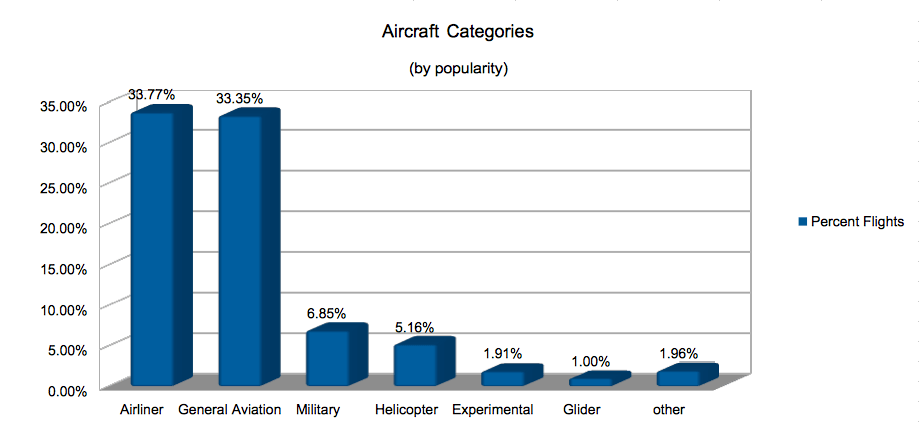
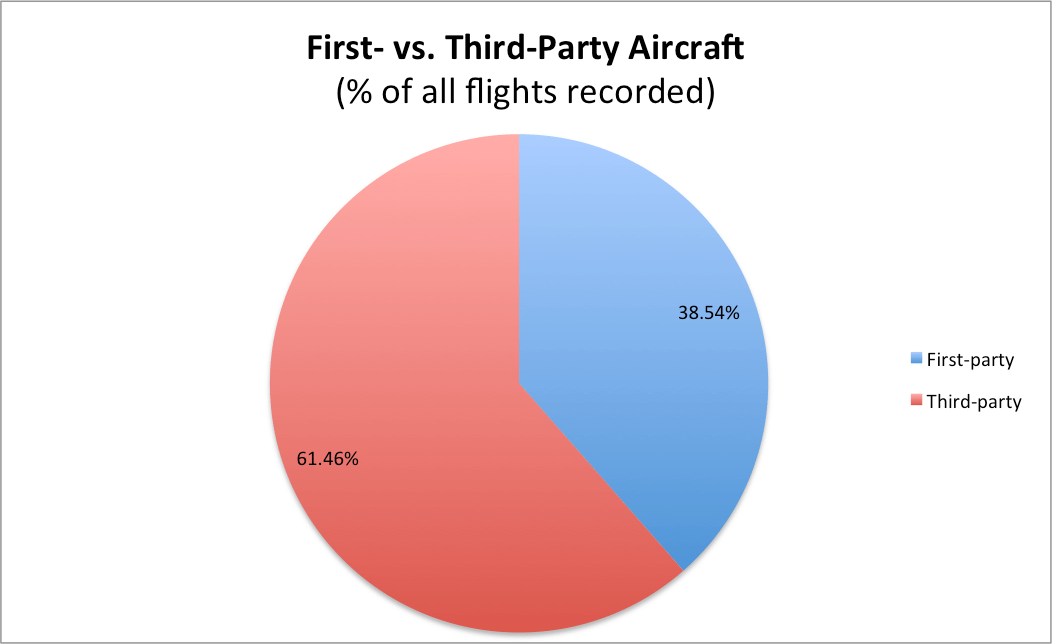
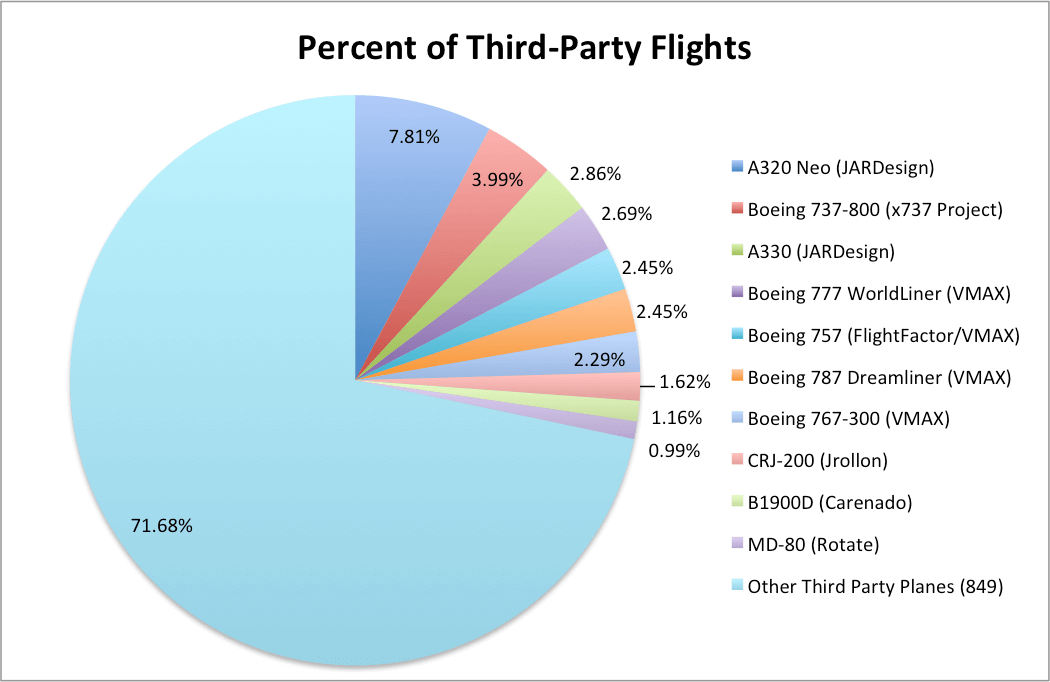
Aircraft
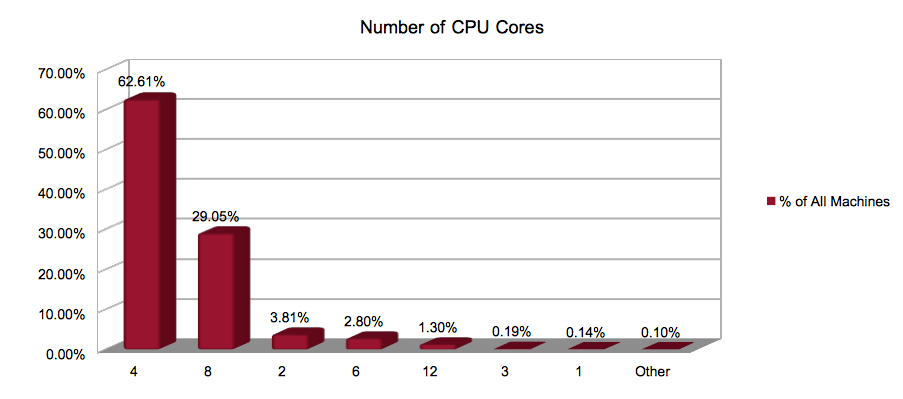
Hardware
Raw Data
There are two files here: hardware data, and aircraft data. Each contains all the information we have since September 2015, for paying customers only (no demo users). I’ve provided two formats for each file: an XLS, and a simple CSV.
Top secret features ! Is that for 10.50 or a future version of X-PLane ?
I don’t think it will make it to 10.50, unfortunately. Once we get closer to having the features finalized, I’ll be able to talk about them publicly. 🙂
I am going to take a wild guess, G1000 ?
The features that are going into 10.50 (static aircraft, global winds aloft, ATC fixes, etc.) are not so secret anymore. 🙂
Neat! I’d like to help present the data in other ways if you’d like. You know, so you can keep working on the X-plane product. 😉 I have lots of experience with various plotting and data viz libraries (flot, Highcharts, d3, etc.).
Oh man, if you’d like to make visualizations of the data, that’d be amazing!
Have a look at this JSON (split up by demo versus full version) and let me know if that’s useful for you: [Redacted because I don’t want this thread to devolve into Fermi estimations of the size of the flight sim market. If you’d like access to the data, shoot me an email at [my first name]@x-plane.com.]
If it is, I can add in the aircraft usage data (and more) and just give you one massive JSON file.
You do realise you just gave away information on your user base count? A little math will give a rough indication of how much Laminar has made from the sale of X-Plane. Or is the data not a secret like the new features which I’m sure most of us a looking forward to having “whatever it may be”
Sigh. This is why we can’t have nice things. I’m going to go ahead and make the data proportional, but for what it’s worth, it’s not quite that simple for a number of reasons. Off the top of my head:
1) The data from the JSON is sampled (in a randomized way) from the full data set. (This is a matter of practicality on our end.)
2) The data has been filtered a bit to remove items below a certain threshold. (Lest we reveal the habits of, say, the one person in the world who owns a particular joystick.)
3) We don’t know what percentage of users opt-in to send usage data. (Ballpark: somewhere between 5% and 50%…??)
4) The distribution of new users versus old users in the data is still likely to be skewed toward the new, since only new users are *forced* to make a decision on data collection. (People who had X-Plane installed prior to 10.40 are automatically opted-out until they open the Operations & Warnings window, at which point they are asked to make a decision.)
5) Software sales skew toward tons and tons of sales upon the release of a new major version, with a much smaller “long tail” following thereafter. Even if we knew *exactly* how many people had fired up X-Plane in the last 6 months, it would tell you relatively little about how many sales we made at the time of the X-Plane 10 release.
Looking to the json file it looks like it is possible to get an idea of the total number of active X-Plane users.
Hey Tyler, great data. Thanks!
Question re: number of cores – are those metrics based on physical or virtual (HT) cores?
Ah, I should have mentioned that! That’s virtual cores, so hyperthreaded CPUs show up with double their number of physical cores. (At some point in the future, we could clean this data up to give the number of physical cores—doing so would require correlating the CPU name with a database of known CPU core counts.)
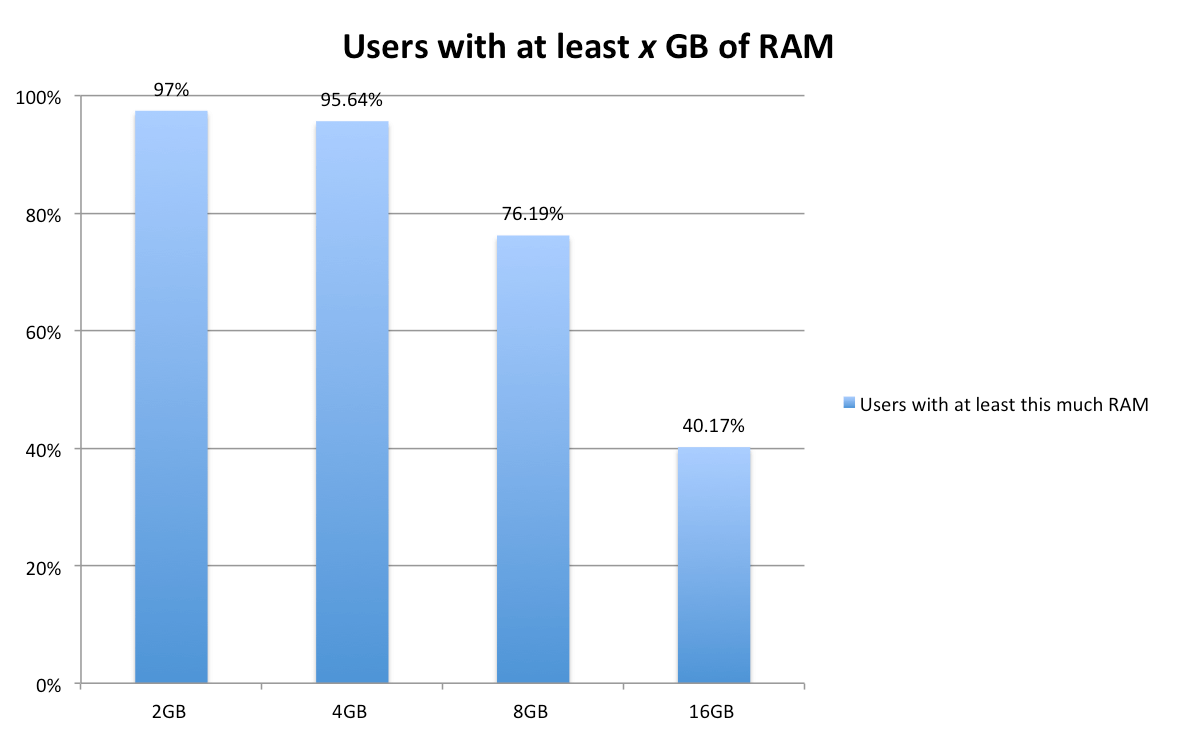
Great data… Are so many people serious about just having 2gb of RAM?, I doubt that would give them a fair run of the simulator in its current form… You need a minimum of 4gb and 6gb just to get you some headroon… Its so cheap today, 8gb for AUS$50 bucks! Crazy? SD
Just to clarify, that graph shows the percentages of users with at least that much RAM (it’s cumulative across the chart). Thus, 97% of users have at least 2 GB of RAM, and 95.64% of users have at least 4 GB of RAM.
Granted, that does mean nearly 5% of users have less than 4 GB, and 3% of users have less than 2 GB (!!).
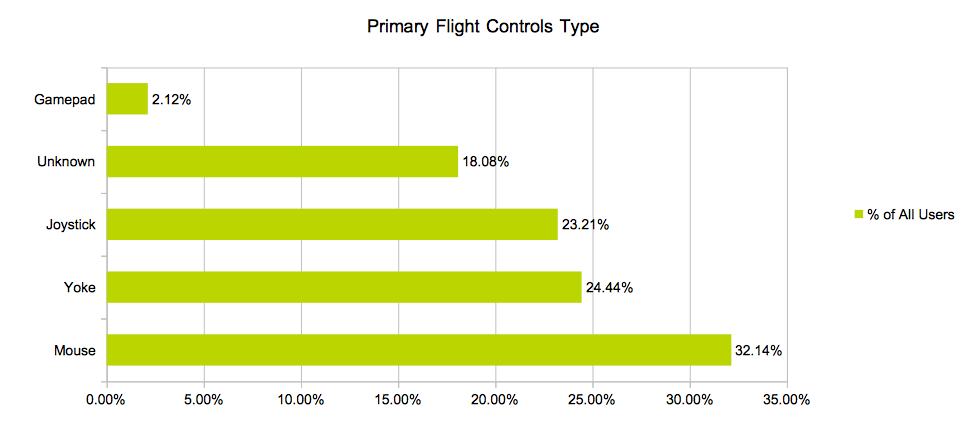
Can’t believe that more people use a mouse to fly than the good old joystick, wow!
Great info, thanks.
Great news guys
A feature i would like to see, is more clouds shapes like CB, would be amazing in xplane.
I’d expect IXEG’s 737 Classic to start making headway soon. Some minor issues to be sorted out but the detail is amazing.
Very interesting stats. Are there also tables available of the airports usage? I’d love to see which are the XP hotspots. Thanks anyway!
Ah, forgot: It would be nice to see what exactly sends XP to you. I assume it’s a simple text file?
Publishing more info is on my to-do list, but it won’t happen soon, unfortunately.
Re: what X-Plane sends, it actually just URL-encodes the information it’s sending, so it makes a request to a URL like this: http://collection-endpoint.com/?gpu=“Intel Integrated”&cpu=”Core i7″&os=”Windows”
After looking upon the data I have the following remarks/questions about the conclusions:
– The amount of flight controls (ca. 80.000) are roughly the double of the amount of cpu’s (ca. 40.000), numbers are extracted from the JSON file. The graph suggest that a mouse is the most important flight control. I think this is overstating the importancy of the mouse as mouse control, because many users use two or more controls.
– There are different flight controls mentioned that will not be used in X-Plane but the are connected to the PC for other purposes. Like steering wheels for racing games. Are only the controls used in X-Plane measured or are all USB controls counted?
– I checked the data with the airplane add-ons I have in my virtual hangar. I discoverd that the SAAB A340 (LES) is not mentioned. I cannot believe that this popular add-on is not used after september.
Two things confound this analysis:
– first, the data from the JSON is sampled (in a randomized way)
– second, it’s been filtered a bit to remove items below a certain threshold.
Re: flight controls, we’re reporting on any controls which could potentially be used to control X-Plane. (There’s nothing except practicality stopping you from using a racing wheel to fly!)
The fact that the SAAB A340 isn’t mentioned means it most likely either a) wasn’t flown by anyone sending usage data in the given time period, or b) was flown a very small number of times by people sending usage data. There’s a third possibility—that it was flown a lot, but was the victim of incredibly unlucky sampling—but that’s very unlikely.
You’ll find the SAAB showing up as:
Airborne Variant – Engines: 2
Cargo Variant – Engines: 2
Passenger Variant – Engines: 2
There are a very curious data, but the most interesting is the 0,1% CPU without a kernel, i.e. “other”. What does it mean?
Ah, in this case, “other” means the user had more than 12 cores—maybe they had a Mac Pro, with 8 to 12 physical cores (and thus 16 to 24 hyperthreaded cores reported in the data collection).
In the raw data, we get a small number of “0” core CPUs—which just indicates that for some reason we couldn’t get information about the CPU from the operating system. (Likewise, we have a few entries in the raw data of people with “0” GB of RAM.)